SSC/HSC Graph Format|| এক ফরমেট দিয়েই সকল Graph লেখা
SSC/HSC Graph Format|| এক ফরমেট দিয়েই সকল Graph লেখা
পরীক্ষায় Graph ভালো নম্বর পাওয়ার জন্য নিচের দেয়া দুটি ফরমেট খুব ভালোভাবে লক্ষ্য কর এবং প্রয়োজনে মুখস্ত করে ফেলো!
তুমি যদি এ Graph ফরম্যাট বুঝো, তাহলে পরীক্ষায় যে কোন গ্রাফ অথবা চার্ট আসুক তুমি খুব সুন্দর করে উত্তর করতে পারবা|
প্রথমে প্রশ্নটি ভালোভাবে বোঝার চেষ্টা করো এবং পরে আমি কিভাবে ফরম্যাটটি দিয়েছি সেটি লক্ষ্য কর! তোমাদের সুবিধার্থে নিচে আরও কয়েকটি এর ছবি করে দিয়েছে দিয়েছি ওইগুলো এর ফরমেট অনুসরণ করে নিজে নিজে পড়ে ফেলার চেষ্টা করবে!
সব Graph লেখার ফরমেট || Graph Format For SSC/HSC
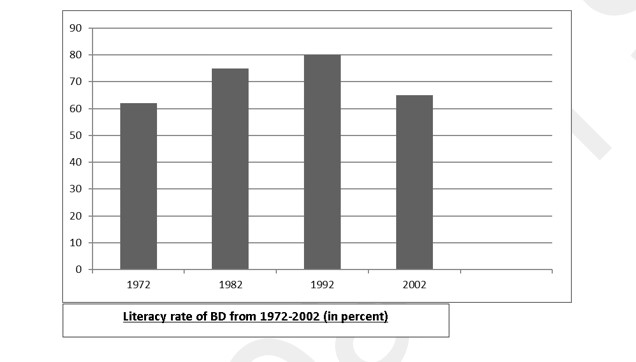
Question Format: Question: The graph below shows the Literacy rate of Bangladesh from 1972-2002. Describe the graph/chart in 150 words. You should highlight and summarise the information given in the graph/chart.

Answer Format of Graph:
The given graph shows the literacy rate of Bangladesh, especially from 1972 to 2002 and the rate has been given in percent.
There are four portions in the graph which represent different years. From the graph, it is very clear that the literacy rate of Bangladesh is in a Fluctuation/gradually increasing/ going down/decreasing day by day. In the very first, that is in 1972, we see, the literacy rate was very low and it was 62 percent.
In the next part/portion/year that is in 1982, the rate has increased radically and it was 75 percent. Actually it was a great /astonishing change in the rate of literacy in Bangladesh. When we move to the next year, it shows in 1992, the rate of literacy was 80 percent which is a slight change from the previous years.
In the last part of the graph, at the year of 2002, the literacy rate was 65 percent and it proves that, the rate of literacy was decreased/increased a little. It was shocking/a great fact for Bangladesh as the rate was suddenly fall down/went up.
In Conclusion / To conclude/in summary, it can be said easily that literacy rate in Bangladesh is now in increasing/decreasing/ a slightly change which must be controlled/improved/observed.
SSC or HSC সব Graph লেখার ফরমেট
Tips for Writing Graph Format:
- Understand the Question:
Read the question carefully and identify the key information like the topic (e.g., literacy rate) and the time frame (1972–2002). - Start with an Overview:
Begin with a general statement about what the graph/chart represents. Include details such as the subject, timeframe, and measurement (percentages, numbers, etc.). - Focus on Key Trends:
Highlight the most noticeable trends or changes, such as increases, decreases, fluctuations, or stability. Use words like “gradually,” “slightly,” “dramatically,” or “sharply” to describe changes. - Use Clear Paragraphs:
Break your answer into small paragraphs for better readability:- First paragraph: Overview.
- Middle paragraphs: Specific trends or data for each portion/year.
- Final paragraph: Conclusion.
- Use Appropriate Vocabulary:
Choose words like “rise,” “fall,” “increase,” “decrease,” “peak,” “decline,” “steadily,” or “sharply” to describe changes in the graph. - Summarize Smartly:
Conclude with an overall trend or a suggestion based on the data provided. - Practice Consistently:
Practice writing graphs using similar formats. This will help you become confident and improve your speed during exams.By following this format and these tips, you will be able to write clear and effective graph answers and secure better marks in your exams!
If you are a student of SSC or HSC and looking for the format of Graph, here is the solution. You can write any sort of graph using this easy format.
SSC Graph Format/HSC Graph Format will help you to get a good mark in exam and you will never fail to answer Graph again, because you have the format of Graph for SSC or Graph for HSC now.
Read more: Using Double Negative in English
